
Read the market
before it moves.
Candlestick and footprint charts of the most traded assets, paired with machine-learning models for regime classification, sentiment, and signals, all through one dashboard.
Free forever. No credit card required.
Candlestick and footprint charts
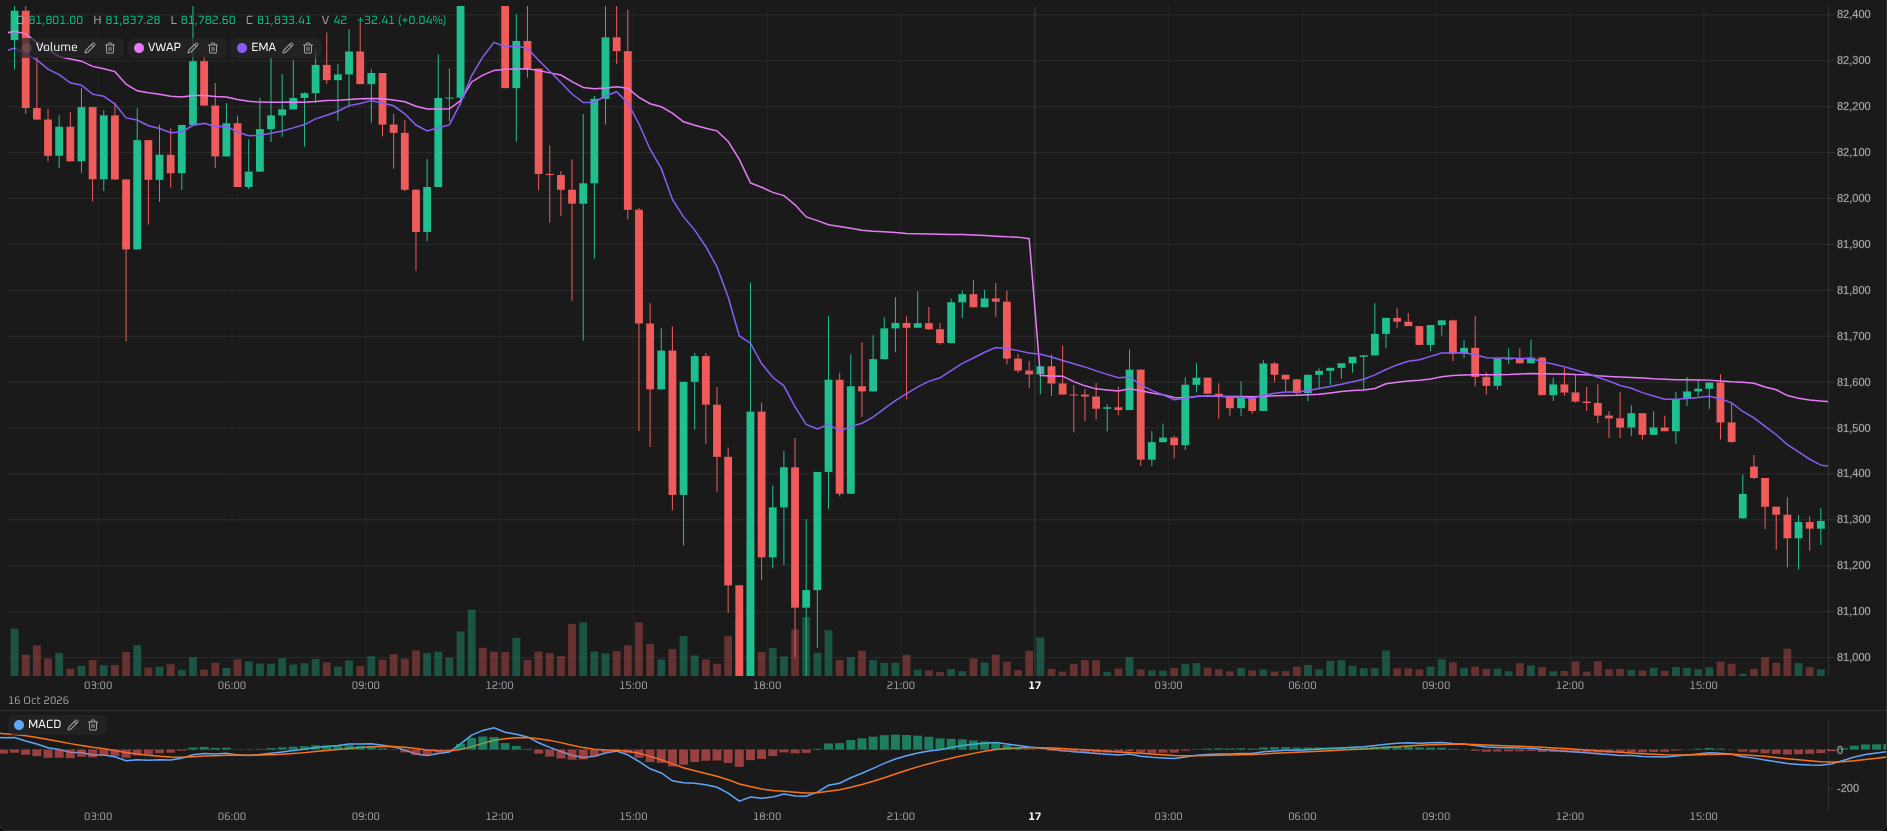
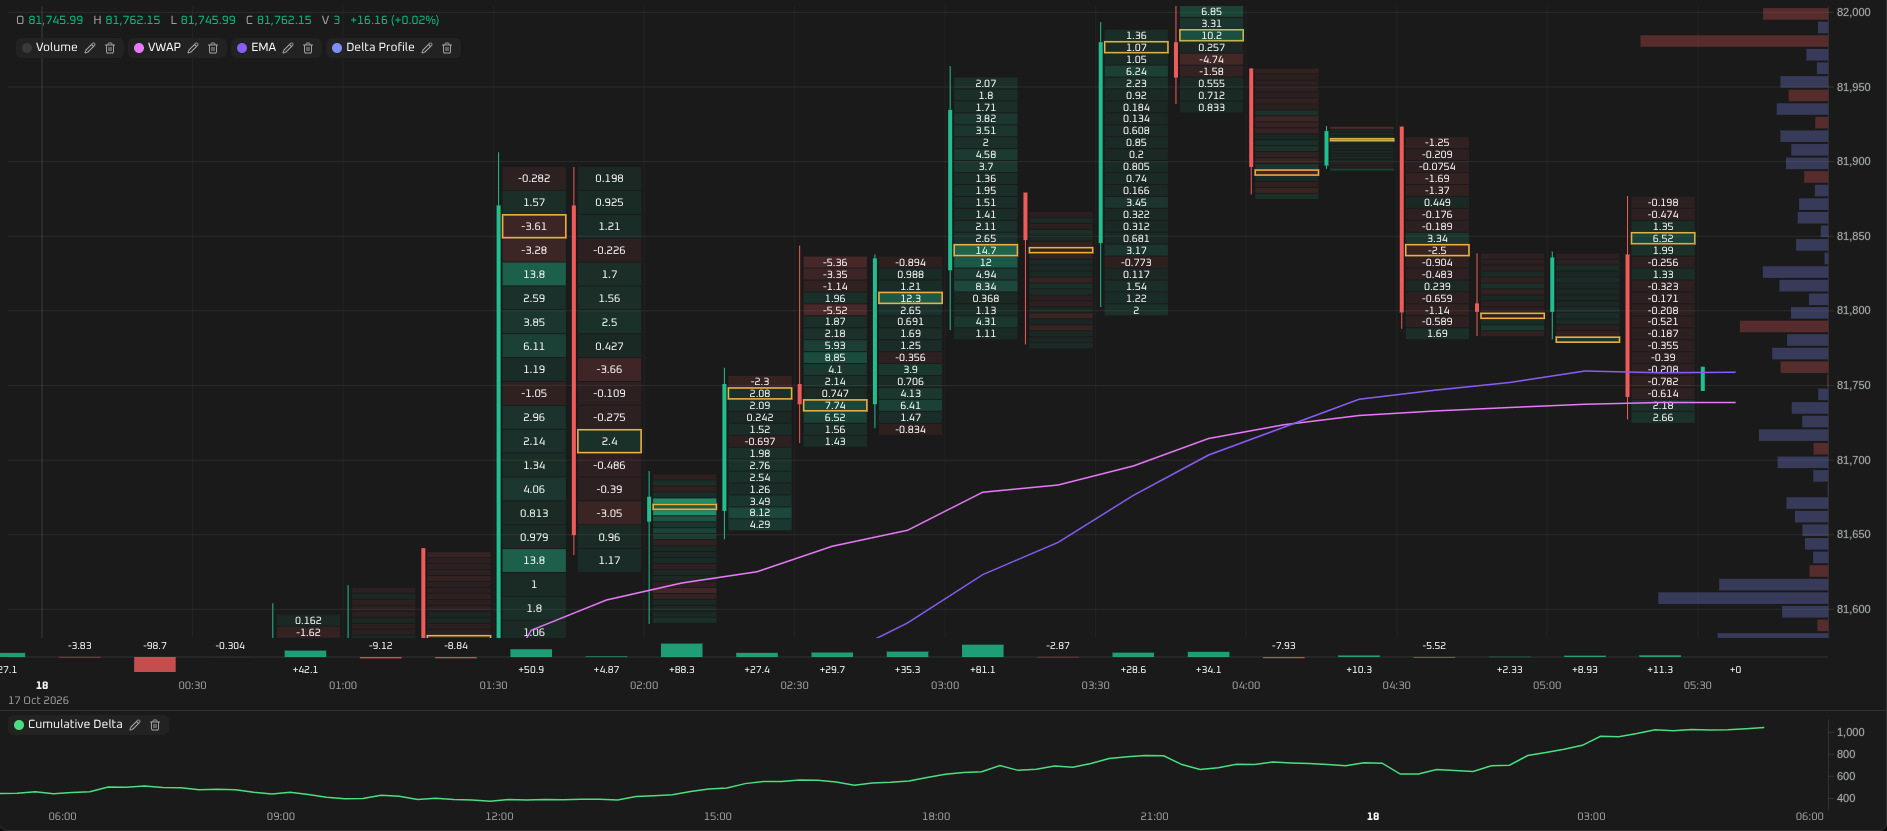
Visualize price action and order-flow footprint for popular crypto assets. Track volume at price, identify liquidity, and read market structure in real time.
Every timeframe, tuned to your strategy
From tick-by-tick scalping to multi-year positioning, Omoxyz streams realtime data across seventeen granularities so your charts match your strategy, not the other way around.
Models that read the market for you
Our models process on-chain and market data to surface three signals you can act on.
01
Regime classification
Detects the current market state: trending, ranging, or volatile so you know which strategy fits.
02
Sentiment score
A normalized score of crowd mood across news, social, and funding data for each asset.
03
Signals
Long, short, and neutral signals derived from the models, with confidence levels.
Bring analytics into your LLM
Omoxyz exposes its analytics over the Model Context Protocol. Connect any MCP-compatible client to query charts, regimes, and signals from your own assistant.
Claude
AnthropicAdd the Omoxyz MCP server to Claude Desktop or the Claude API and ask for market state in natural language.
OpenAI
ChatGPT / APIConnect through any OpenAI-compatible client that supports MCP tools to surface signals inside your workflow.
Any client that speaks the MCP (Model Context Protocol) works: Claude, OpenAI, and more.
Start analyzing markets today
Free forever. Every chart, model, and integration included.